First Solo Cross-Country
A week ago (June 15), I went on my first solo cross country flight. The plan was to fly KARB → KMBS → KAMN → KARB. In case you don’t happen to have the Detroit sectional chart in front of you, this might help you visualize the scope of the flight.
| leg | distance | time | |
| KARB | → KMBS | 79 nm | 47 min |
| KMBS | → KAMN | 29 nm | 20 min |
| KAMN | → KARB | 79 nm | 46 min |
| Total | 187 nm | 113 min |
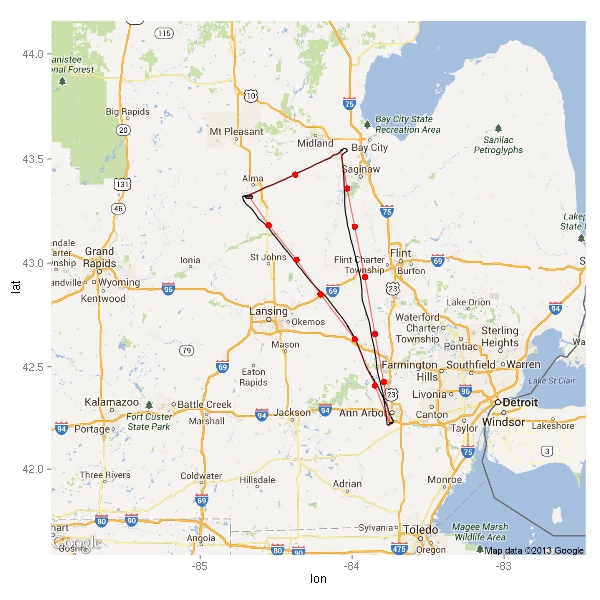
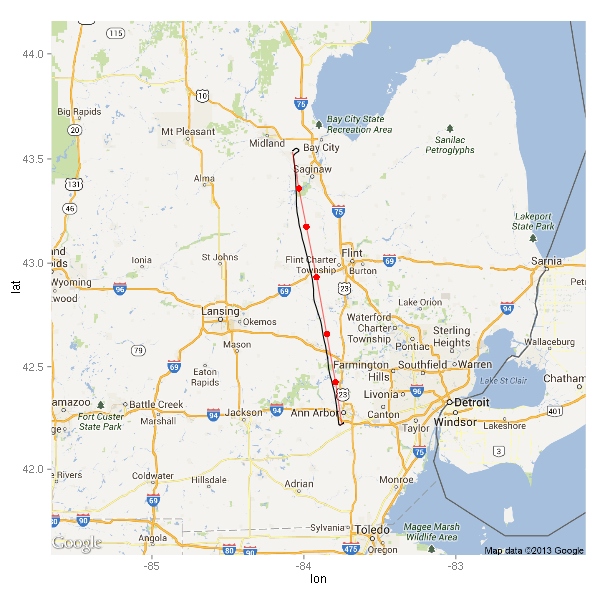
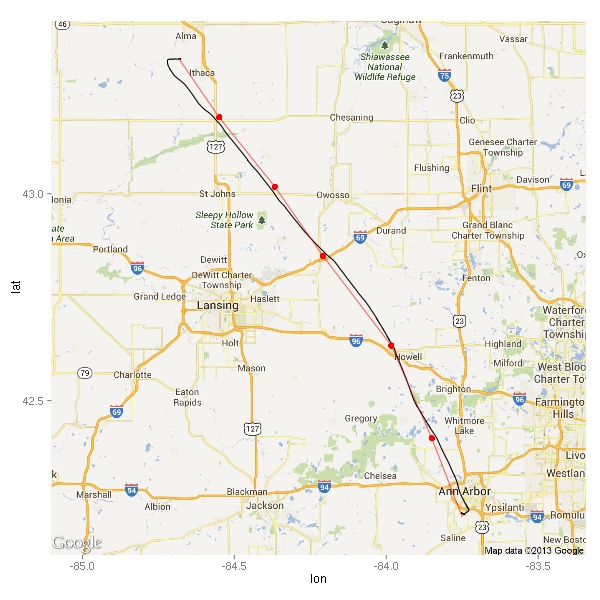
Here’s the ground track (as recorded by the G1000) along with red dots for each of my checkpoints and a pink line connecting them. (Sadly, there’s no convenient zoom level that covers the entire track without excessive waste.)
As you can see, I didn’t quite overfly all the checkpoints. In my defense, the forecast winds were about 40 degrees off from reality during the first half of the flight. :)
Let’s examine each leg separately.
KARB → KMBS
My checkpoint by I-69 (southwest of Flint) was supposed to be a I-69 and Pontiac VORTAC (PSI) radial 311 intersection. However when I called up the FSS briefer, I found out that it was out of service. Thankfully, Salem VORTAC (SVM) is very close so I just used its radial 339 instead. Next time I’m using a VOR for any part of my planning, I’m going to check for any NOTAMs before I make it part of my plan — redoing portions of the plan is tedious and not fun.
On the way to Saginaw, I was planning to go at 3500. (Yes, I know, it is a westerly direction and the rule (FAR 91.159) says even thousand + 500, but the clouds were not high enough to fly at 4500 and the rule only applies 3000 AGL and above — the ground around these parts is 700-1000 feet MSL.)
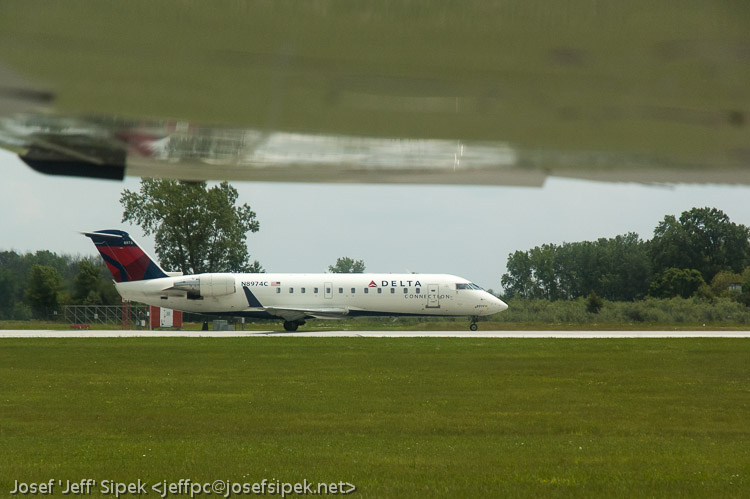
Right when I entered the downwind for runway 23, the tower cleared me to land. My clearance was quickly followed by the tower instructing a commuter jet to hold short of 23 because of landing traffic — me! Somehow, it is very satisfying to see a real plane (CRJ-200) have to wait for little ol’ me to land. (FlightAware tells me that it was FLG3903 flight to KDTW.)
While I was on taxiway C, they got cleared to take off. I couldn’t help it but to snap a photo.
It was a pretty slow day for Saginaw. The whole time I was on the radio with Saginaw approach, I got to hear maybe 5 planes total. The tower was even less busy. There were no planes around except for me and the commuter jet.
KMBS → KAMN
This leg of the flight was the hardest. First of all, it was only 29 nm. This equated to about 25 minutes of flying. The first four-ish and the last five-ish were spent climbing and descending, so really there was about 15 minutes of cruising. Not much time to begin with. I flew this leg by following the MBS VOR radial 248. My one and only checkpoint on this leg was mid way — the beginning of a wind turbine farm. It took about 2 minutes longer to get there than planned, but the wind turbines were easy to see from distance so no problems there.
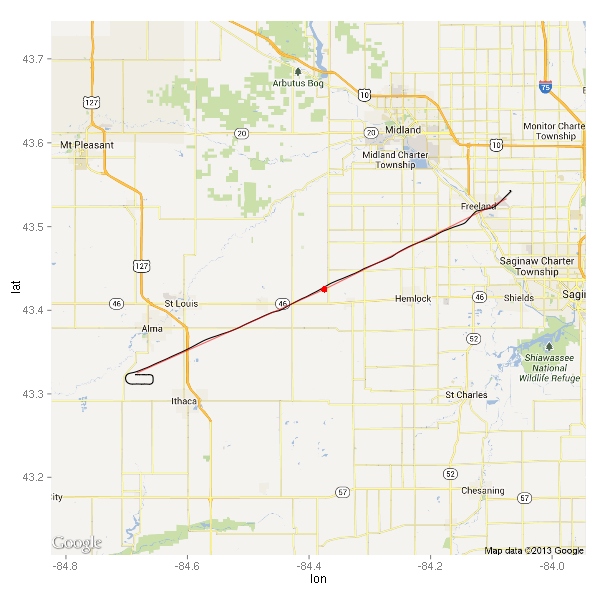
Following the VOR wasn’t difficult, but you can see in the ground track that I was meandering across it. As expected, it got easier the farther away from the station I got. Here’s the plot of the CDI deflection for this leg. The CSV file says that the units are “fsd” — I have no idea what that means.
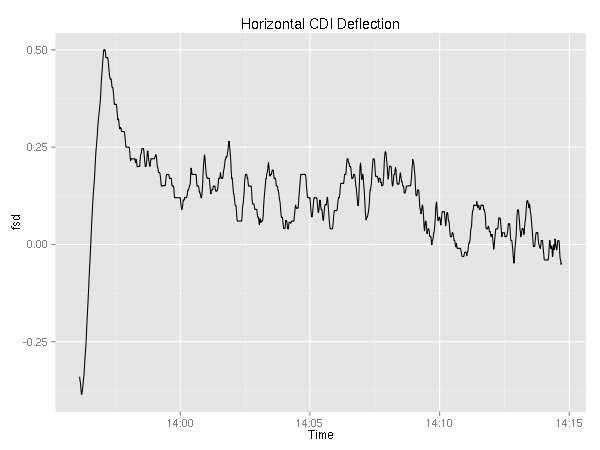
I can’t really draw any conclusions because…well, I don’t know what the graph is telling me. Sure, it seems to get closer and closer to zero (which I assume is a good thing), but I can’t honestly say that I understand what the graph is saying.
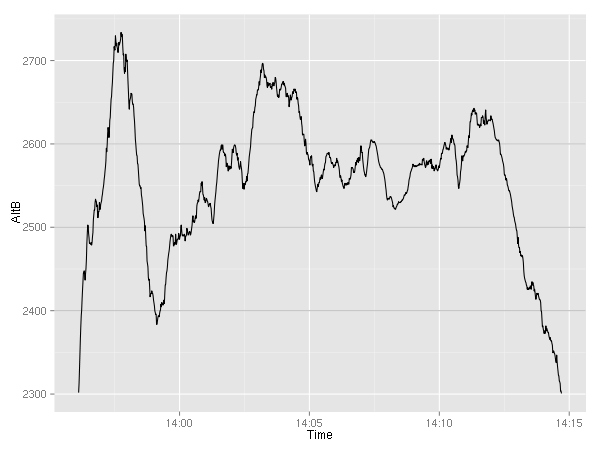
The most difficult part was trying to stay at 2500 feet. For whatever reason, it felt like I was flying in sizable thermals. Since there were no thunderstorms in the area, I flew on fighting the updrafts. That was the difficult part. I suspect the wind turbines were built there because the area is windy.
KAMN is a decent size airport. Two plenty long runways for a 172 even on a hot day (5004x75 feet and 3197x75 feet). I didn’t stop by the FBO, so I have no idea how they are. I did not notice anyone else around during the couple of minutes I spent on the ground taxiing and getting ready for the next leg. Maybe it was just the overcast that made people stay indoors. Oh well. It is a nice airport, and I wouldn’t mind stopping there in the future if the need arose.
KAMN → KARB
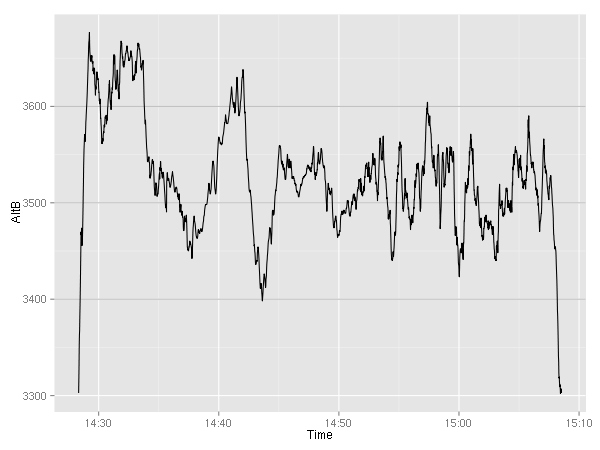
Flying back to Ann Arbor was the easy part of the trip. The air calmed down enough that once trimmed, the plane more or less stayed at 3500 feet.
It apparently was a slow day for Lansing approach as well, as I got to hear a controller chatting with a pilot of a skydiving plane about how fast the skydivers fell to the ground. Sadly, I didn’t get to hear the end of the conversation since the controller told me to contact Detroit approach.
As far as the ground track is concerned, you can see two places where I stopped flying current heading and instead flew toward the next checkpoint visually. The first instance is a few miles north of KOZW. I spotted the airport, and since I knew I was supposed to overfly it, I turned to it and flew right over it. The second instance is by Whitmore Lake — there I looked into the distance and saw Ann Arbor. Knowing that the airport is on the south side, I just headed right toward it ignoring the planned heading. As I mentioned before in both cases, the planned course was slightly off because the winds weren’t quite like the forecast said they would be.
You can’t tell from the rather low resolution of the map, but I got to fly right over the  Michigan stadium. Sadly, I was a bit too busy flying the plane to take a photo of the field below me.
Next
With one solo cross country out of the way, I’m still trying to figure out where I want to go next. Currently, I am considering one of these flights (in no particular order):
| path | distance | time |
| KARB KGRR KMOP KARB | 239 nm | 2h19m |
| KARB KBIV KJXN KARB | 220 nm | 2h08m |
| KARB KFWA KTOL KARB | 210 nm | 2h03m |
| KARB CRUXX KFWA KTOL KARB | 210 nm | 2h06m |
| KARB LFD KFWA KTOL KARB | 225 nm | 2h12m |
| KARB KAZO KOEB KTOL KARB | 207 nm | 2h01m |
| KARB KMBS KGRR KARB | 243 nm | 2h21m |
| KARB KGRR KEKM KARB | 266 nm | 2h40m |
