Dumping & restoring XFS volumes
Over the past few years, I’ve been using XFS wherever I could. I never really tried to tweak the mkfs options, and therefore most of my filesystems were quite sub-optimal. I managed to get my hands on an external 500GB disk that I decided to use for all this data shuffling…
320GB external firewire disk
This was probably the most offenseively made fs. Here’s the old info:
meta-data=/dev/sdb1      isize=512    agcount=17, agsize=4724999 blks
         =               sectsz=512   attr=1
data     =               bsize=4096   blocks=78142042, imaxpct=25
         =               sunit=0      swidth=0 blks, unwritten=1
naming   =version 2      bsize=4096
log      =internal       bsize=4096   blocks=32768, version=2
         =               sectsz=512   sunit=0 blks, lazy-count=0
realtime =none           extsz=65536  blocks=0, rtextents=0
It had 512 byte inodes (instead of the more sane, and default 256 byte inodes) because I was playing around with SELinux when I made this filesystem, and the bigger inodes allow more extended attributes to be stored there — improving performance a whole lot. When I first made the fs, it had 16 allocation groups, but I grew the filesystem about 10GB which were used by a FAT32 partition that I used for Windows ↔ Linux data shuffling. On a simple disk (e.g., not a RAID 5), 4 allocation groups is far more logical then the 17 I had before. Another thing I wanted to use is the lazy-count. That got introduced in 2.6.23, and improved performance when multiple processes were filesystem metadata (create/unlink/mkdir/rmdir). And last, but not least, I wanted to use version 2 inodes.
The simples way to change all the filesystem to use these features is to backup, mkfs, and restore…and that’s what I did.
This is what the fs is like after the whole process (note that isize, agcount, attr, and lazy-count changed):
meta-data=/dev/sdb1      isize=256    agcount=4, agsize=19535511 blks
         =               sectsz=512   attr=2
data     =               bsize=4096   blocks=78142042, imaxpct=25
         =               sunit=0      swidth=0 blks
naming   =version 2      bsize=4096
log      =internal       bsize=4096   blocks=32768, version=2
         =               sectsz=512   sunit=0 blks, lazy-count=1
realtime =none           extsz=4096   blocks=0, rtextents=0
dumping…
I mkfs.xfs’d the 500GB disk, and mounted it on /mnt/dump. Since I like tinkering with storage, I couldn’t help but start blktrace for both of the disks (the one being dumped, and the one storing the dump).
Instead of using rsync, tar, or dd, I went with xfsdump/xfsrestore combo. xfsdump is a lot like tar — it creates a single with with all the data, but unlike tar, it also saves extended attributes, and preserves the hole information for sparse files. So, with blktrace running, it was time to start the dump:
# xfsdump -f /mnt/dump/acomdata_xfs.dump -p 60 -J /mnt/acomdata
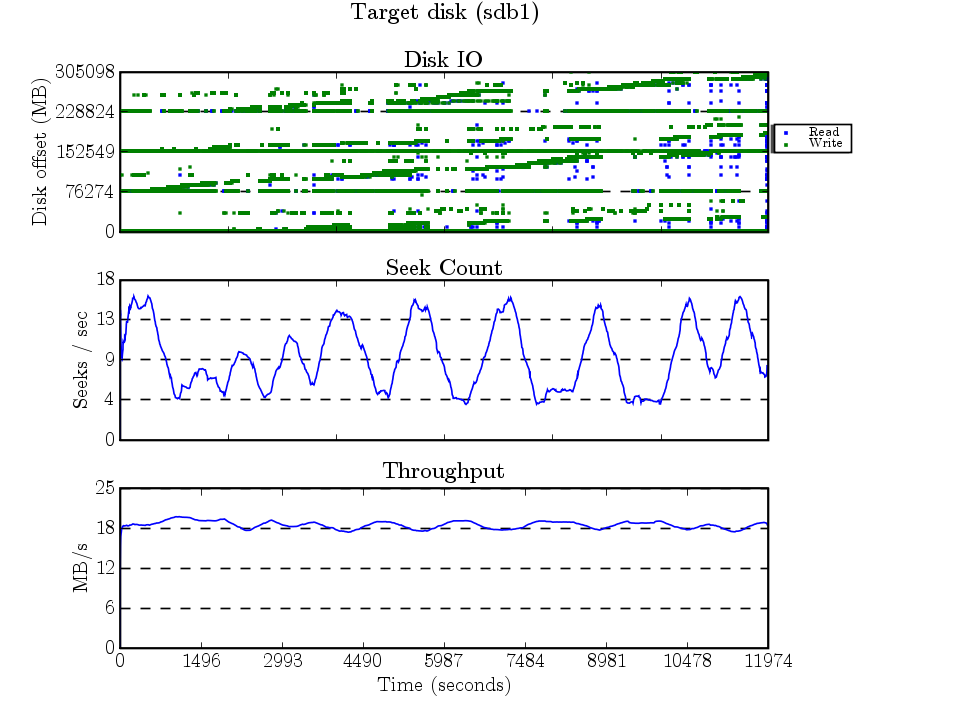
The dump took about 9300 seconds (2 hours, 35 mins). Here are the graphs created by seekwatcher (which uses the blktrace traces)…The source disk is the firewire disk being dumped, and the target disk is the one being dumped to.
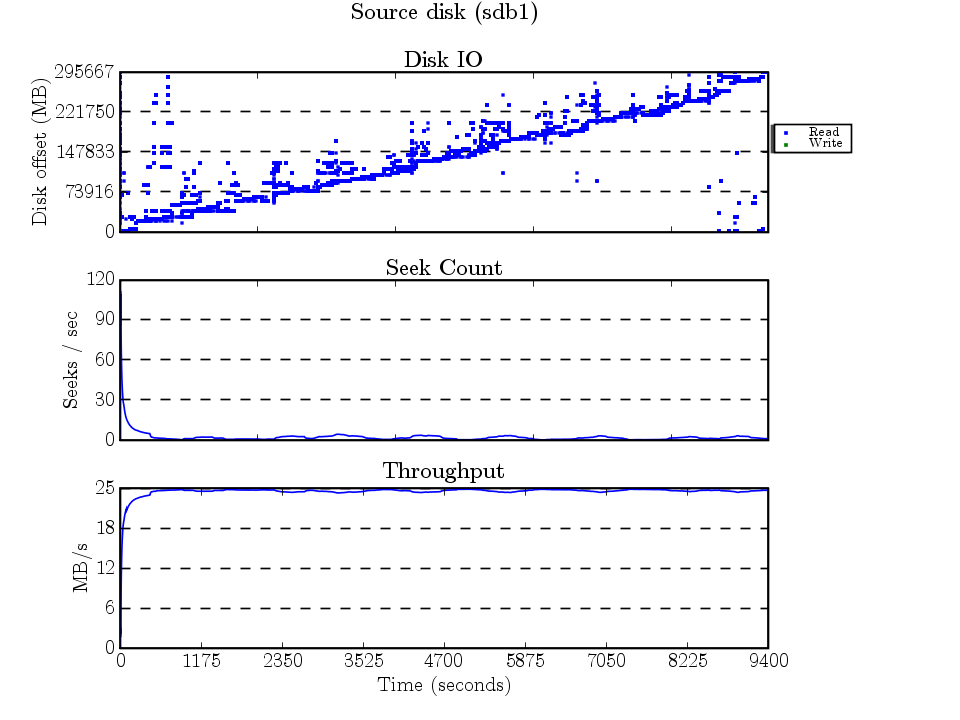
The IO here makes sense, xfsdump scans the entire filesystem — and backs up every inode sorted by the inode number (which is a function of the block number). The scattered accesses are because of fragmented files having data all over the place.
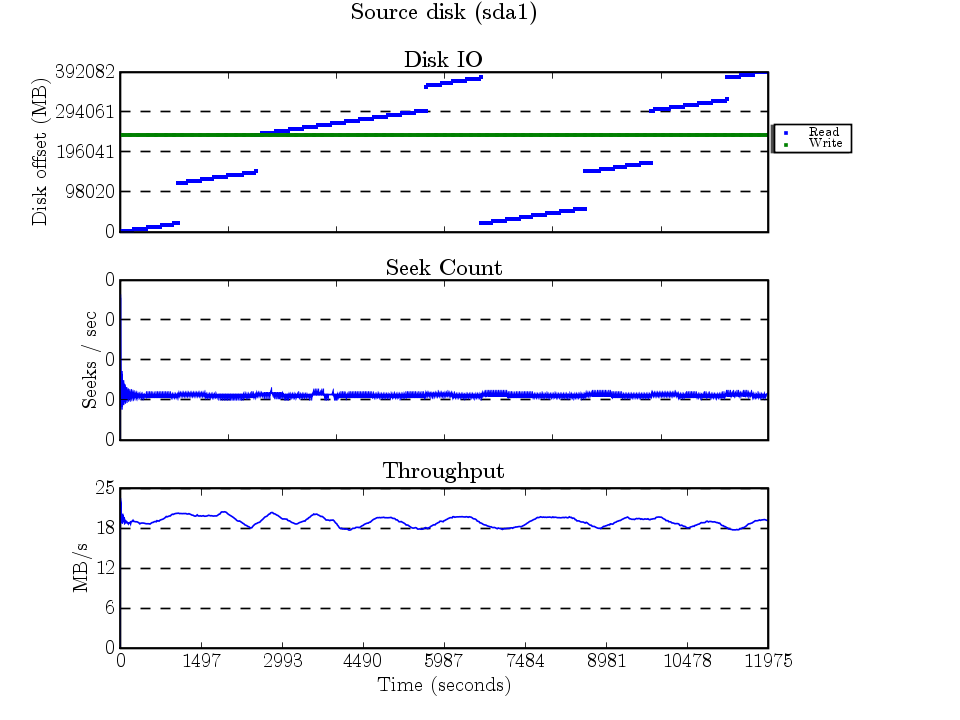
I’m not quite sure why XFS decided to break the dump file into 8 extents. These extents show up nicely as the 8 ascending lines. The horizontal line ~250GB is the journal being written to. (The seeks/second graph’s y-axis shows that seekwatcher has a bug when there’s very little seeking :) )
…and restoring
After the dump finished, I unmounted the 320GB fs, and ran mkfs on it (lazy-count=1, agcount=4, etc.). Then it was time to mount, start a new blktrace run on the 2 disks, and run xfsrestore — to extract all the files from the dump.
# xfsrestore -f /mnt/dump/acomdata_xfs.dump -p 60 -A -B -J /mnt/acomdata
I used the -A option to NOT restore xattrs as the only xattrs that were on the filesystem were some stray SELinux labels that managed to survive.
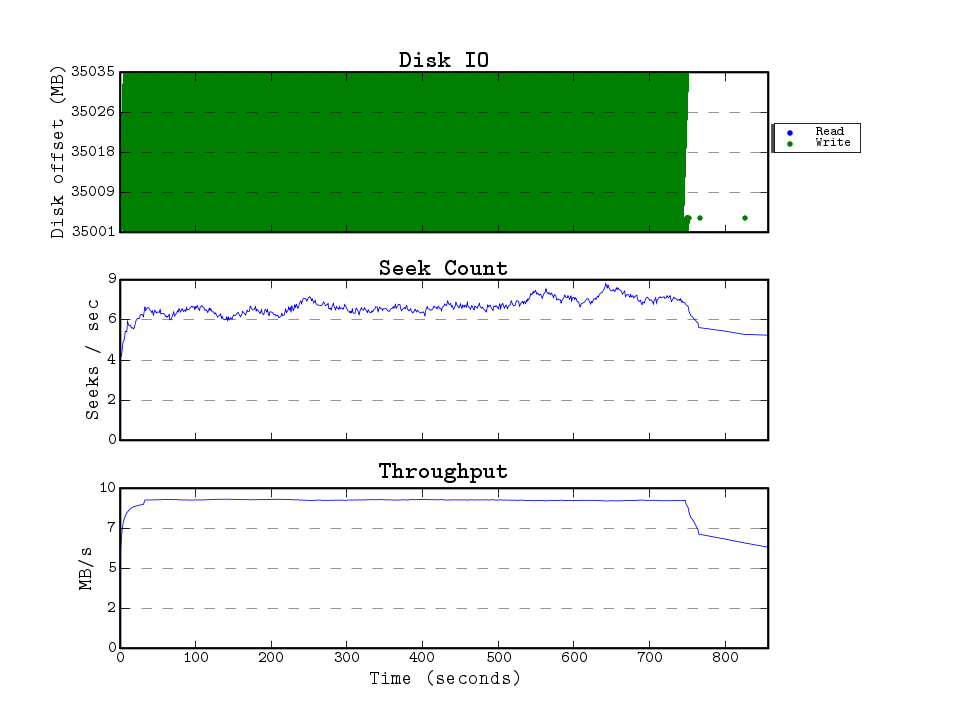
The restore took a bit longer…12000 seconds (3 hours, 20 minutes). And here are the traces for the restore:
Reading the 240GB file that was in 8 extents created a IO trace that’s pretty self explanatory. The constant writing to the journal was probably because of the inode access time updates. (And again, seekwatcher managed to round the seeks/second y-axis labels.)
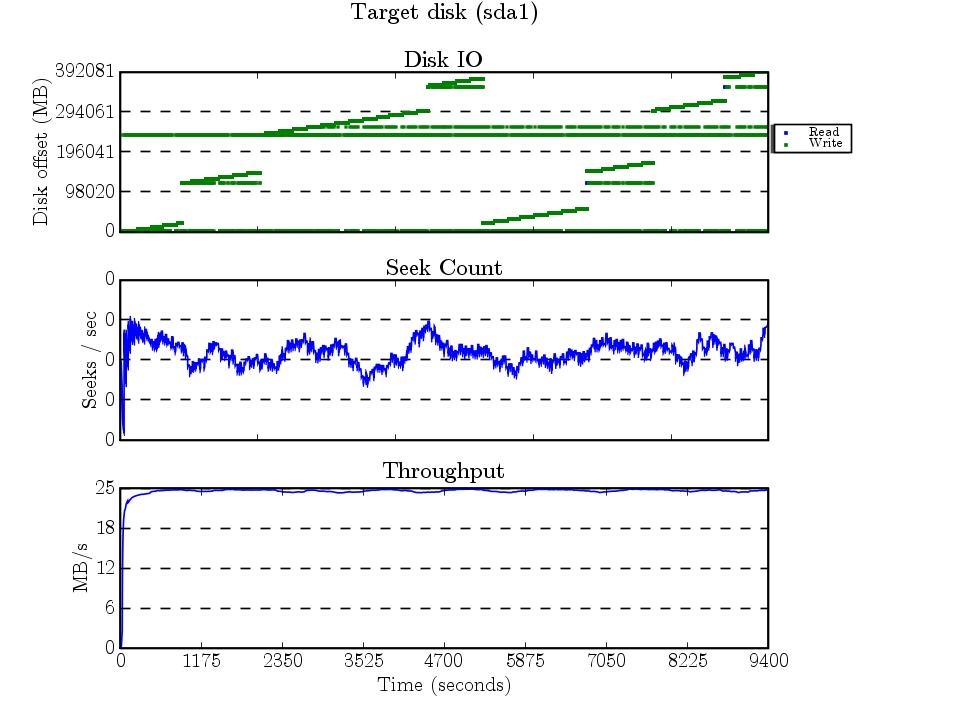
This looks messy, but it actually isn’t bad at all. The 4 horizontal lines that look a lot like journal writes are probably the superblocks being updated to reflect the inode counts (4 allocation groups == 4 sets superblock + ag structures).
some analysis…
After the restore, I ran some debug tools to see how clean the filesystem ended up being…
…fragmentation
37945 extents used, ideal 37298 == not bad at all
…free space fragmentation
   from      to extents  blocks    pct
      1       1      19      19   0.00
      2       3       1       3   0.00
     64     127       2     150   0.00
    128     255       1     134   0.00
    512    1023       1     584   0.00
   4096    8191       1    4682   0.02
  32768   65535       1   36662   0.19
 131072  262143       1  224301   1.16
 262144  524287       3 1315076   6.79
 524288 1048575       2 1469184   7.59
1048576 2097151       4 6524753  33.71
2097152 4194303       4 9780810  50.53
== pretty much sqeaky clean
…per allocation group block usage
/dev/sdb1:
AG     1K-blocks         Used    Available    Use%
  0     78142044     40118136     38023908     51%
  1     78142044     78142040            4     99%
  2     78142044     42565780     35576264     54%
  3     78142036     74316844      3825192     95%
ALL    312568168    235142800     77425368     75%
I’m somewhat surprised that the 2nd and 4th are near full (well, 2nd ag has only 4kB free!), while the 1st and 3rd are only half full. As you can see, the 320GB disk is 75% used.
Bonus features
I decided to render mpeg versions of the IO traces…
source disk (dump) (4MB)
target disk (dump) (2MB)
source disk (restore) (2MB)
target disk (restore) (4.1MB) ← this is the best one of the bunch