D750: A Year In Statistics
It has been a year since I got the D750 and I thought it would be fun to gather some statistics about the photos.
While I have used a total of 5 different lenses with the D750, only three of them got to see any serious use. The lenses are:
- Nikon AF Nikkor 50mm f/1.8D
- This is the lens I used for the first month. Old, cheap, but very good.
- Nikon AF Nikkor 70-300mm f/4-5.6D ED
- I got this lens many years ago for my D70. During the first month of D750 ownership, I couldn’t resist seeing what it would behave like on the D750. It was a disaster. This lens just doesn’t create a good enough image for the D750’s 24 megapixel sensor.
- Nikon AF-S Nikkor 24-120mm f/4 ED VR
- I used this lens when I test-drove the D750, so technically I didn’t take these with my camera. With that said, I’m including it because it makes some of the graphs look more interesting.
- Nikon AF-S Nikkor 24-70mm f/2.8G ED
- After a month of using the 50mm, I got this lens which became my walk around lens.
- Nikon AF-S Nikkor 70-200mm f/2.8G ED VR II
- Back in June, Nikon had a sale and that ended up being just good enough to convince me to spend more money on photography gear.
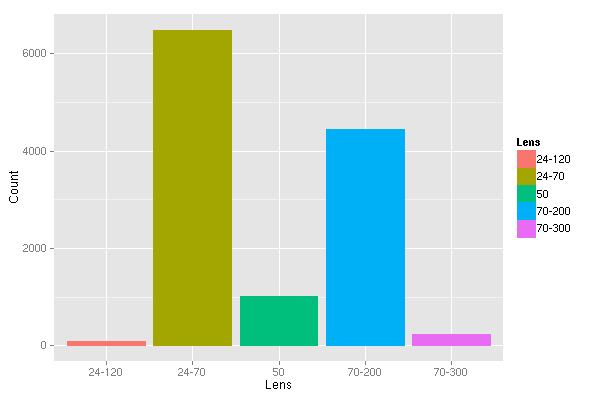
Now that we’ve covered what lenses I have used, let’s take a look at some graphs. First of all, the number of images taken with each lens:

Not very surprising. Since June, I have been taking with me either the 24-70mm, or 70-200mm, or both if the extra weight is not a bother. So it is no surprise that the vast majority of my photos have been taken with those two lenses. The 50mm is all about that first month when I had a new toy (the D750!) and so I dragged it everywhere. (And to be fair, the 50mm lens is so compact that it is really easy to drag it everywhere.) The 230 photos taken with the 70-300mm are all (failed) attempts at plane spotting photography.
First, let’s look at the breakdown by ISO (in 1/3 stop increments):

This is not a surprising graph at all. The D750’s base ISO is 100 and the maximum native ISO is 12800. It is therefore no surprise that most of the photos were taken at ISO 100.
I am a bit amused by the spikes at 200, 400, and 800. I know exactly why these happen—when I have to adjust the exposure by a large amount, I tend to scroll the wheels a multiple of three notches.
Outside of the range, there are a couple of photos (52) taken at ISO 50 (which Nikon calls “Lo 1”) to work around the lack of an ND filter. There is actually one other photo outside of the native ISO range that I did not plot at all—the one photo I took at ISO 51200 (“Hi 2”) as a test.
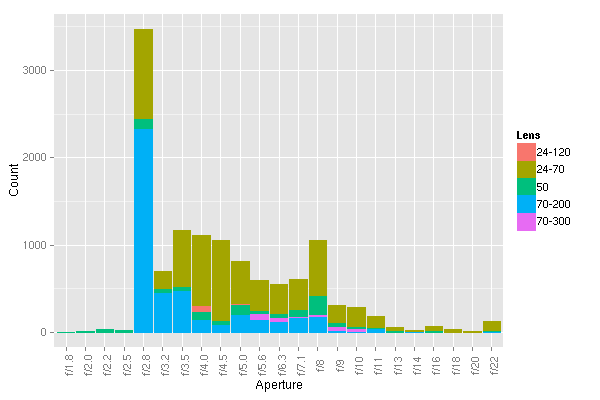
Now, let’s break the numbers down differently—by the aperture used (again in 1/3 stop increments):

I am actually surprised that so many of them are at f/2.8. I’m well aware that most lenses need to be stepped down a little for best image quality, but apparently I don’t do that a third of the time. It is for this kind of insight that I decided to make this blahg post.
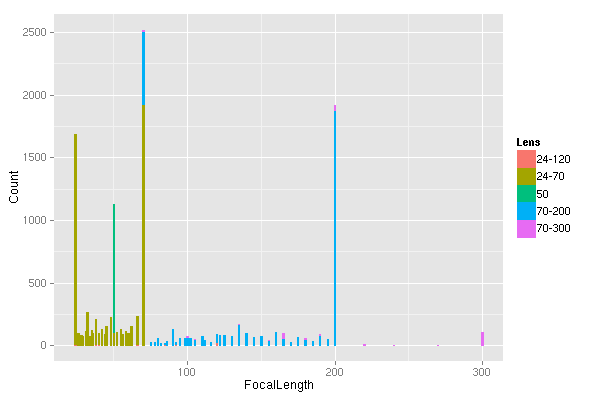
Moving on to focal length. This is by far the least interesting graph.

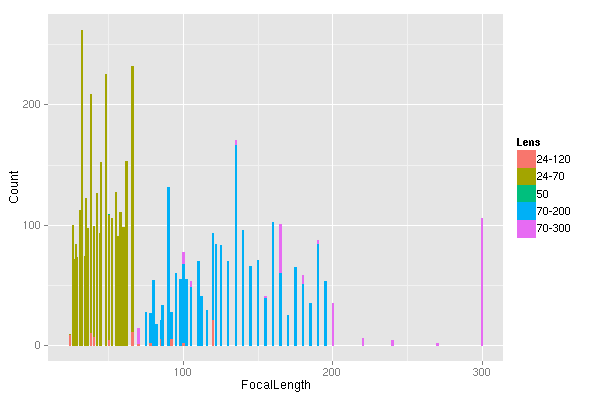
You can clearly see 4 large spikes—at 24 mm, 50 mm, 70 mm, and 200 mm. All of those are because of focal length limits of the lenses. Removing any data points over 500 yields a slightly more readable graph:

It is interesting that the focal length that is embedded in the image doesn’t seem to be just any integer, but rather there appear to be “steps” in which it changes. The step also isn’t constant. For example, the 70-200mm lens seems to encode 5 mm steps above approximately 130 mm but 2-3 mm below it.
I realize this is a useless number given that we are dealing with nothing like a unimodal distribution, but I was curious what the mean focal length was. (I already know that the most common ones are 24 mm and 70 mm for the 24-70mm, and 70 mm and 200 mm for the 70-200mm lens.)
| Lens | Mean Focal Length | Count |
| 24-120 | 73.24138 | 87 |
| 24-70 | 46.72043 | 6485 |
| 50 | 50.00000 | 1020 |
| 70-200 | 151.69536 | 4438 |
| 70-300 | 227.82609 | 230 |
Keep in mind these numbers include the removed spikes.
Just eyeballing the shutter speed data, I think that it isn’t even worth plotting.
So, that’s it for this year. I found the (basic) statistics interesting enough, and I learned that I stay at f/2.8 a bit too much.