Josef “Jeff” Sipek

Performance Co-Pilot: Part 2, Enabling PMDAs

In my previous post, I introduced Performance Co-Pilot (PCP). I know, I promised the next post to be about logging, but I thought I’d make a short detour and show how to install more PMDAs.

After installing PCP on a Linux system, you will have access to somewhere around 850 various metrics from the three basic PMDAs (pmcd, linux, and mmv). There are many more metrics that you can get at if you enable some of the non-default PMDAs.

I pondered what the best way to present a simple howto would be, and then I realized that simply copying & pasting a session where I install a PMDA will do.

First of all, all the PMDAs live in /var/lib/pcp/pmdas/.

# cd /var/lib/pcp/pmdas/
# ls
apache	 gpsd	    lustrecomm	mounts	   news     process   sendmail	systemtap  vmware
bonding  kvm	    mailq	mysql	   pdns     roomtemp  shping	trace	   weblog
cisco	 linux	    memcache	named	   pmcd     samba     simple	trivial    zimbra
dbping	 lmsensors  mmv		netfilter  postfix  sample    summary	txmon

In this post, I will use the PowerDNS PMDA as an example, but the steps are the same for the other PMDAs.

# cd pdns/
# ls
Install  Remove  pmdapdns.pl

As you can see, there are three files in this directory. We are interested in the Install script. Simply run it as root, and when it asks whether you want a collector, a monitor, or both answer appropriately — if you are running the daemon on the same host, answering both is your best bet. (I never had the need to answer anything else.)

# ./Install 
You will need to choose an appropriate configuration for installation of
the "pdns" Performance Metrics Domain Agent (PMDA).

  collector	collect performance statistics on this system
  monitor	allow this system to monitor local and/or remote systems
  both		collector and monitor configuration for this system

Please enter c(ollector) or m(onitor) or b(oth) [b] 
Updating the Performance Metrics Name Space (PMNS) ...
Compiled PMNS contains
	  197 hash table entries
	  847 leaf nodes
	  132 non-leaf nodes
	 8149 bytes of symbol table
Terminate PMDA if already installed ...
Updating the PMCD control file, and notifying PMCD ...
Check pdns metrics have appeared ... 22 warnings, 60 metrics and 42 values

At this point, the PMDA has been installed (take a look at /etc/pmcd/pmcd.conf to see the new config line there enabling the new PMDA). Now, we can see the new metrics using pminfo (there are many more, I just pruned the list for brevity):

# pminfo pdns
pdns.packetcache_hit
pdns.tcp_answers
pdns.packetcache_miss

We are done!

If you decide to uninstall a PMDA, just cd into the directory and run the Remove script.

Performance Co-Pilot: Part 1, Introduction

I decided to write a series of posts about one piece of software — Performance Co-Pilot, or PCP for short. (I am aware that the project webpage isn’t the greatest, but don’t let that make you ignore a great piece of software.)

What is PCP

First of all, what is PCP? Let me start by quoting a bit from the PCP webpage:

Performance Co-Pilot (PCP) provides a framework and services to support system-level performance monitoring and management. It presents a unifying abstraction for all of the performance data in a system, and many tools for interrogating, retrieving and processing that data.

If you ever administered a server, you know that there are times when you want to know answers to pretty simple questions: what’s the load average on server X, or what’s the current network utilization on server Y, or memory usage, number of processes, number of logged in users, disk bandwidth usage, filesystem usage, etc., etc. You may have written some scripts that try to answer those questions, or used some of the other monitoring frameworks out there (e.g., Ganglia, Cacti). PCP is rather unique in the way it handles monitoring.

PCP architecture

PCP has a three major parts:

PMDAs
PMDAs (short for Performance Metrics Domain Agents) are metric collectors. Each PMDA knows how to retrieve certain system information. For example, the Linux PMDA knows how to parse all the information in /proc, the PowerDNS PMDA knows how to get statistics from the PowerDNS daemons, the MySQL PMDA knows how to get stats from MySQL, etc. There are 35 different PMDAs installed that cover various often used daemons and system services — Apache, KVM, lmsensors, memcached, MySQL, Bind, PowerDNS, Postfix, Samba, Sendmail, VmWare, Zimbra, and more.
PMCD
PMCD (short for Performance Metric Collector Daemon) is responsible for answering client (see below) requests for metrics, and calls into the various PMDAs to retrieve the requested metrics.
client software
The various pieces of client software contact the PMCD (via TCP/IP) and request one or more metrics.

Why not use Ganglia/Cacti/other rrdtool-based software?

As is stated on the rrdtool website, rrdtool is a high performance data logging and graphing system for time series data. So, why not use it? First of all, rrdtool doesn’t collect data; it merely stores it for later retrieval or graphing. This means that if you want to collect data, you still need something to collect it with — a script that parses /proc files and hands the values to rrdtool for storage.

Cacti and Ganglia are just two examples of the many rrdtool-based system logging solutions. Personally, I find them to be a bit too heavy weight (why do I want PHP and MySQL on my logger server?), cumbersome to use (e.g., clunky web interfaces), and just not flexible enough.

Additionally, PCP supports Linux, Solaris, Mac OS X, and even Microsoft Windows. You can use the same tools to monitor your entire network!

Why not use SNMP?

SNMP is a protocol that exposes a hierarchy of variables that often include some performance metrics (e.g., the number of bytes and packets transfered over a network interface). If, however, you want MySQL statistics, you need to write your own stat extractor that feeds it into the SNMP daemon — not very hard, but it still takes some effort.

In this series of posts, I hope to demonstrate to you that PCP is superior to these solutions.

Installation

Debian is my distro of choice, so I’m going to make some Debian-centric assumptions.

On Debian, PCP is packaged so installing it is as easy as:

# aptitude install pcp pcp-gui

Distros that are Debian derivatives (e.g., Ubuntu) should have a package as well. Fedora, RHEL, and SLES have packages as well.

At the end of installation, the Debian package automatically starts the PMCD.

At this point, we only care about the Linux PMDA. By default, anyone that can make a TCP/IP connection to the host can read and write the metrics. (The PMCD has a couple of “metrics” that can be changed — they affect how PMCD behaves.) My suggestion is to set up an access control list. This is what the default config file (/etc/pmcd/pmcd.conf) looks like:

# Performance Metrics Domain Specifications
# 
# This file is automatically generated during the build
# Name  Id      IPC     IPC Params      File/Cmd
pmcd	2	dso	pmcd_init	/var/lib/pcp/pmdas/pmcd/pmda_pmcd.so
linux	60	dso	linux_init	/var/lib/pcp/pmdas/linux/pmda_linux.so
mmv	70	dso	mmv_init	/var/lib/pcp/pmdas/mmv/pmda_mmv.so

PMCD allows for a simple access control list in the config file (/etc/pmcd/pmcd.conf), and it would be a good idea to set one up to allow only specific hosts to access it. Here’s an example of what the new config file would look like:

# Performance Metrics Domain Specifications
# 
# This file is automatically generated during the build
# Name  Id      IPC     IPC Params      File/Cmd
pmcd	2	dso	pmcd_init	/var/lib/pcp/pmdas/pmcd/pmda_pmcd.so
linux	60	dso	linux_init	/var/lib/pcp/pmdas/linux/pmda_linux.so
mmv	70	dso	mmv_init	/var/lib/pcp/pmdas/mmv/pmda_mmv.so

[access]
allow localhost, 127.0.0.1 : all;
allow 10.1.*, 10.2.* : fetch;
allow home.josefsipek.net : all;
disallow * : all;

It allows reads and writes from localhost and home.josefsipek.net, and only reads from 10.1.* and 10.2.*. You’ll have to restart PCP for the change to take place:

# /etc/init.d/pcp restart

First Test

Now that we have PCP installed and running, let’s query it for the list of metrics. We’ll use the pminfo utility. By default it assumes that we want to query the localhost.

$ pminfo

If you want to query another host, you can specify its name or IP using the -h argument. For example,

$ pminfo -h example.com

On my system it spits out 851 different metrics. Here’s a pruned list that includes the more interesting ones:

kernel.all.nusers
kernel.all.load
kernel.all.cpu.user
kernel.all.cpu.sys
kernel.all.cpu.idle
kernel.percpu.cpu.user
mem.physmem
mem.freemem
network.interface.in.bytes
network.interface.out.bytes
disk.dev.read_bytes
disk.dev.write_bytes
filesys.capacity
filesys.used
proc.nprocs
proc.psinfo.cmd

We can use the -f argument to fetch the current value, and for simplicity, let’s specify the specific metric we are interested in:

$ pminfo -f kernel.all.nusers 

kernel.all.nusers
    value 2

So, at the moment, there are two users logged in. Now, let’s check the load average:

$ pminfo -f kernel.all.load 

kernel.all.load
    inst [1 or "1 minute"] value 0.0099999998
    inst [5 or "5 minute"] value 0.02
    inst [15 or "15 minute"] value 0

We can see that pminfo returned 3 values — called instances in PCP speak.

I should note that some of the metric values don’t seem to make much sense unless you already know what they represent. Have no fear! pminfo has two arguments that display a short (-t) or a long (-T) help text. For example, the following command will tell us what what kernel.all.load keeps track of.

pminfo -T kernel.all.load

You can use pminfo to fetch all the metrics you want, or you can use one of the other utilities which do some additional magic.

pmdumptext is one such utility. Suppose we want to watch how the disk utilization changes over time. Here’s the command:

$ pmdumptext -mu disk.dev.read_bytes
Time	disk.dev.read_bytes["sda"]	disk.dev.read_bytes["hda"]
none	Kbyte / second	Kbyte / second
Fri Apr  1 16:15:36	?	?
Fri Apr  1 16:15:37	0.000	0.000
Fri Apr  1 16:15:38	248.003	0.000
Fri Apr  1 16:15:39	1748.117	0.000
Fri Apr  1 16:15:40	543.985	0.000
Fri Apr  1 16:15:41	536.041	0.000
Fri Apr  1 16:15:42	331.968	0.000
Fri Apr  1 16:15:43	2299.862	0.000
Fri Apr  1 16:15:44	6112.226	0.000
Fri Apr  1 16:15:45	8187.725	0.000
Fri Apr  1 16:15:46	1212.029	0.000
Fri Apr  1 16:15:47	84.002	0.000
Fri Apr  1 16:15:48	143.990	0.000
Fri Apr  1 16:15:49	963.538	0.000
Fri Apr  1 16:15:50	64.003	0.000
Fri Apr  1 16:15:51	0.000	0.000
Fri Apr  1 16:15:52	0.000	0.000

The first column contains the date and time, the remaining column are the time-converted metrics/instances. That is, between each line of output, PCP calculated the average utilization and printed that out. The arguments (-m and -u) print the first two lines of the output — the name of the metric/instance, and the units. pmdumptext gets the units from the PMCD along with information whether or not it should rate convert the values (it will rate convert “bytes” to “bytes/sec”, but if there is a metric representing the current latency it will leave it alone).

You can change the amount of time between updates with the -t option. As before, you can use -h to specify the hostname. For example:

pmdumptext -mu -t 15sec -h example.com disk.dev.read_bytes
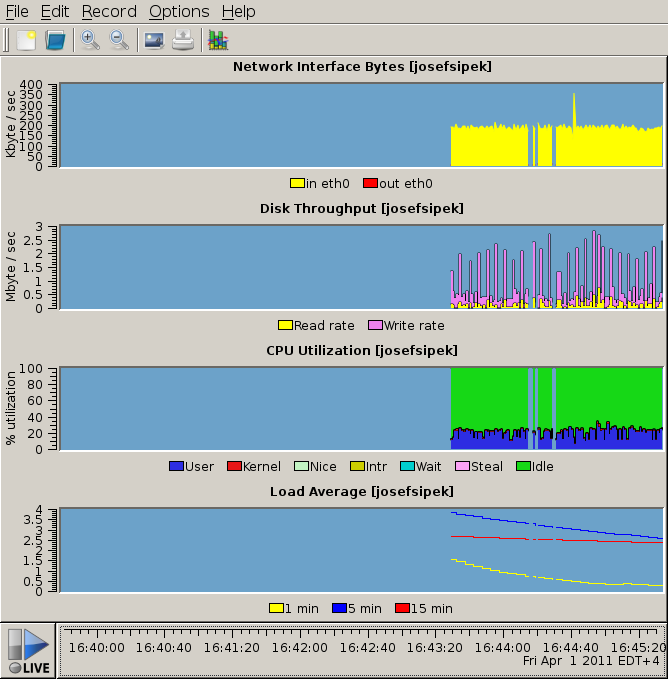
GUI

pmdumptext is great, but sometimes you want something more…graphical. Again, there’s a program for that. It’s called pmchart. It’s pretty self-explanatory, so I’ll just show you a screenshot of it in action:

pmchart in action

Next time, I’ll cover PCP’s logging facility.

Think!

Alright, it ain’t rocket science. When you are trying to decide which filesystem to use, and you see a 7 year old article which talks about people having problems with the fs on Red Hat 7.x (running 2.4.18 kernels), are you going to assume that nothing changed? What if all the developers tell you that things changed? Are you still going to believe the slashdot article? Grrr… No one is forcing you to use this filesystem, so if you believe a 7-year old /. article, then go away and don’t waste the developers’ & others’ time.

Extracting RPMs and DEBs

Every so often I needed to extract a .deb package manually. Usually I ended up installing Midnight Commander, and used it to copy the contents out. This time around, I did some search, and found a straight forward description how to do it for .debs and .rpms.

RPM

rpm2cpio mypackage.rpm | cpio -vid

DEB

ar vx mypackage.deb
tar -xzvf data.tar.gz

or

ar p mypackage.deb data.tar.gz | tar zx

QUERY_STRING & mod_rewrite

A few months ago, I needed to make some mod_rewrite rules that did things to the QUERY_STRING. After a lot of searching and unsuccessful attempts, I found this document (local mirror). Some experimenting later, I had it all working nicely.

For example, I’ve got something like:

RewriteCond %{QUERY_STRING}    ^page=([0-9]{1,})$
RewriteRule ^/testsite/$       /testsite/page.cgi?seek=%1       [PT,L]

Blahg outage

As some of you may have noticed, my blahg has been down for about 2 days. The reason is, I upgraded my system, and php4 packages broke. I just installed the php5 packages, and things seem to work again.

Wordpress sucks, archive.org rocks

This is a follow up post to Wordpress sucks from a week ago.

I decided to try to figure out some more category names, and then it hit me…my site is crawled from time to time by The Wayback Machine. So, I searched, and found a copy from November 2007. Not the latest, but quite new enough to have all the categories I had. A little while later, my blahg is back to its former glory. And there was much rejoicing.

Wordpress sucks

As I mentioned in my previous post, I decided to upgrade my Wordpress install. Every single time I upgraded it, I have no problems whatsoever. So, this time around, I didn’t make a backup of the DB tables. Well, that was quite stupid of me. I copy over the new files (2.6 release tarball), and run the upgrade script. Poop! I lost all the category labels and descriptions. Gah! Absolutely, not fun. I have 40 categories, and now they don’t have any labels. Well, not anymore, I’m trying to figure out which category id was which category (sometimes not as easy as it should be). I got some, I’m not sure about some. If you had links to any categories, they’ll still work. If you had links to any posts, they’ll still work. Things will just look a bit disorganized if you look at the list of categories on the website, or if you look at which categories a post belongs to.

Please send any and all hate mail to the Wordpress developers for breaking an upgrade from one stable release to another.

mbox vs. maildir

Over the past two weeks, I decided to try converting some of the mboxes I have for mailing lists to maildirs. Last time I tried to do it, I noticed an unacceptable delay when I started mutt. Not when I tried to load the largest maildir. That made me give up.

For fun (or was it profit? ;) ), I decided to try again. And again, I saw that delay. This time around, I ran strace on mutt, and I found out that my custom .muttrc was making mutt believe that every file in the maildir was an mbox. Fixing up my .muttrc made the delay go away. Now, I have start up times that are the same as with purely mbox setup, but opening up these maildirs takes up WAY less time. I’m talking fraction of second instead of 5-10 seconds.

I’m considering converting all but the spam box to maildir. I really don’t need thousands of extra inodes which I’ll never use anyway, but at the same time, I don’t mind having one gigantic file full of the spam messages (I keep them because I don’t manually check that no good messages got misclassified by spamassassin). I am going to probably tell XFS to reserve some diskspace for it, to prevent lots of fragmentation from the constant open-write-close syscall cycle.

Dumping & restoring XFS volumes

Over the past few years, I’ve been using XFS wherever I could. I never really tried to tweak the mkfs options, and therefore most of my filesystems were quite sub-optimal. I managed to get my hands on an external 500GB disk that I decided to use for all this data shuffling…

320GB external firewire disk

This was probably the most offenseively made fs. Here’s the old info:

meta-data=/dev/sdb1      isize=512    agcount=17, agsize=4724999 blks
         =               sectsz=512   attr=1
data     =               bsize=4096   blocks=78142042, imaxpct=25
         =               sunit=0      swidth=0 blks, unwritten=1
naming   =version 2      bsize=4096  
log      =internal       bsize=4096   blocks=32768, version=2
         =               sectsz=512   sunit=0 blks, lazy-count=0
realtime =none           extsz=65536  blocks=0, rtextents=0

It had 512 byte inodes (instead of the more sane, and default 256 byte inodes) because I was playing around with SELinux when I made this filesystem, and the bigger inodes allow more extended attributes to be stored there — improving performance a whole lot. When I first made the fs, it had 16 allocation groups, but I grew the filesystem about 10GB which were used by a FAT32 partition that I used for Windows ↔ Linux data shuffling. On a simple disk (e.g., not a RAID 5), 4 allocation groups is far more logical then the 17 I had before. Another thing I wanted to use is the lazy-count. That got introduced in 2.6.23, and improved performance when multiple processes were filesystem metadata (create/unlink/mkdir/rmdir). And last, but not least, I wanted to use version 2 inodes.

The simples way to change all the filesystem to use these features is to backup, mkfs, and restore…and that’s what I did.

This is what the fs is like after the whole process (note that isize, agcount, attr, and lazy-count changed):

meta-data=/dev/sdb1      isize=256    agcount=4, agsize=19535511 blks
         =               sectsz=512   attr=2
data     =               bsize=4096   blocks=78142042, imaxpct=25
         =               sunit=0      swidth=0 blks
naming   =version 2      bsize=4096
log      =internal       bsize=4096   blocks=32768, version=2
         =               sectsz=512   sunit=0 blks, lazy-count=1
realtime =none           extsz=4096   blocks=0, rtextents=0

dumping…

I mkfs.xfs’d the 500GB disk, and mounted it on /mnt/dump. Since I like tinkering with storage, I couldn’t help but start blktrace for both of the disks (the one being dumped, and the one storing the dump).

Instead of using rsync, tar, or dd, I went with xfsdump/xfsrestore combo. xfsdump is a lot like tar — it creates a single with with all the data, but unlike tar, it also saves extended attributes, and preserves the hole information for sparse files. So, with blktrace running, it was time to start the dump:

# xfsdump -f /mnt/dump/acomdata_xfs.dump -p 60 -J /mnt/acomdata

The dump took about 9300 seconds (2 hours, 35 mins). Here are the graphs created by seekwatcher (which uses the blktrace traces)…The source disk is the firewire disk being dumped, and the target disk is the one being dumped to.

source disk

The IO here makes sense, xfsdump scans the entire filesystem — and backs up every inode sorted by the inode number (which is a function of the block number). The scattered accesses are because of fragmented files having data all over the place.

target disk

I’m not quite sure why XFS decided to break the dump file into 8 extents. These extents show up nicely as the 8 ascending lines. The horizontal line ~250GB is the journal being written to. (The seeks/second graph’s y-axis shows that seekwatcher has a bug when there’s very little seeking :) )

…and restoring

After the dump finished, I unmounted the 320GB fs, and ran mkfs on it (lazy-count=1, agcount=4, etc.). Then it was time to mount, start a new blktrace run on the 2 disks, and run xfsrestore — to extract all the files from the dump.

# xfsrestore -f /mnt/dump/acomdata_xfs.dump -p 60 -A -B -J /mnt/acomdata

I used the -A option to NOT restore xattrs as the only xattrs that were on the filesystem were some stray SELinux labels that managed to survive.

The restore took a bit longer…12000 seconds (3 hours, 20 minutes). And here are the traces for the restore:

source disk

Reading the 240GB file that was in 8 extents created a IO trace that’s pretty self explanatory. The constant writing to the journal was probably because of the inode access time updates. (And again, seekwatcher managed to round the seeks/second y-axis labels.)

target disk

This looks messy, but it actually isn’t bad at all. The 4 horizontal lines that look a lot like journal writes are probably the superblocks being updated to reflect the inode counts (4 allocation groups == 4 sets superblock + ag structures).

some analysis…

After the restore, I ran some debug tools to see how clean the filesystem ended up being…

…fragmentation

37945 extents used, ideal 37298 == not bad at all

…free space fragmentation

   from      to extents  blocks    pct
      1       1      19      19   0.00
      2       3       1       3   0.00
     64     127       2     150   0.00
    128     255       1     134   0.00
    512    1023       1     584   0.00
   4096    8191       1    4682   0.02
  32768   65535       1   36662   0.19
 131072  262143       1  224301   1.16
 262144  524287       3 1315076   6.79
 524288 1048575       2 1469184   7.59
1048576 2097151       4 6524753  33.71
2097152 4194303       4 9780810  50.53

== pretty much sqeaky clean

…per allocation group block usage

/dev/sdb1:
AG     1K-blocks         Used    Available    Use%
  0     78142044     40118136     38023908     51%
  1     78142044     78142040            4     99%
  2     78142044     42565780     35576264     54%
  3     78142036     74316844      3825192     95%
ALL    312568168    235142800     77425368     75%

I’m somewhat surprised that the 2nd and 4th are near full (well, 2nd ag has only 4kB free!), while the 1st and 3rd are only half full. As you can see, the 320GB disk is 75% used.

Bonus features

I decided to render mpeg versions of the IO traces…

source disk (dump) (4MB)
target disk (dump) (2MB)
source disk (restore) (2MB)
target disk (restore) (4.1MB) ← this is the best one of the bunch

Powered by blahgd